

Fragility
The economic history of the last century has been marked by sinusoidal swings between government fine tuning of the economy and free markets. The triumph of war time planning had brought Keynesian economics on to the world stage. Today we see a re-emergence of Keynesian ideas, though with markedly different outcomes.
The trusted tools of conventional monetary policy that have been used for over 70 have seemingly had very little effect. Lowering interest rates decreases the cost of borrowing for agents in the economy and in practice does stimulate growth, however such policies may have limited effects for highly leveraged countries. A 2009 paper published by Rogoff and Reinhart found that empirically, countries with a debt to GDP ratio of greater 90% face a 1% lower median growth rate. Clearly the circumstance under which debt is accumulated is critical to understanding the effectiveness of fiscal and monetary policies.

Central bank balance sheet as a percentage of GDP
War-time debts are less problematic given the transfer of organized labour to the civilian economy and the cessation of war spending as hostilities cease. Excessive debt accumulated under peace time can be harmful to long term growth prospects. The Federal Reserve, Bank of England, ECB and the Bank of Japan have significantly increased their balance sheets since the summer of 2007. Whilst a large amount of the initial balance sheet increase was attributed to direct investments in companies and the purchase of toxic assets, the recent growth of the balance sheet is primarily from the use of unconventional monetary policies devised to work around the zero bound on nominal interest rates. Credit easing, quantitative easing, and signaling are the new tools which central bankers are using to bring life back to the global economy. In theory the outright purchase of long dated securities to flatten the yield curve should promote savers to investment their cash into the economy.
To date it is arguable how effective these policies have been. Whilst major global equity indices have rallied back to their pre-crisis levels, there is a disconnect between financial asset performance and the real economy. Unemployment in the U.S. has remained stagnant below the 8% mark (refer to previous page chart), while the situation is far worse in Eurozone. This disconnect could be indicative of either an investor preference to allocate cash to financial markets versus traditional job generating investments in hard assets, or the limited effects of monetary policy given a series of debt related crises around the world. I believe it is a mix of both of these factors which have stunted the effects of expansionary monetary policy. Central bank balance sheets and national debt levels have grown to such an extent that they pose very credible long term dangers to the global economy.

Major global indices have recovered; different story with unemployment
In an environment where asset prices have been inflated due to record low interest rates, there are very few asset classes which remain undervalued. Moreover, the notion of being long in an asset that is undervalued will become increasingly difficult to justify. If anything, the dangers of advanced economy leverage poses more risk to inflated asset prices. In this environment, it is much easier to look for the low hanging fruit which run contrarian to recent market trends. A very attractive asset class which offers asymmetric payoffs is credit protection and more specifically, Japanese credit default swaps (CDS)
Japan has for years accumulated significant debts in an attempt to stimulate its economy through both fiscal and monetary policy. From 1990 to fiscal 2013 outstanding government debt grew from 166 trillion to 750 trillion yen (excluding FILP bonds ). This represents an annual growth of approximately 7%.

Outstanding JGB and interest payments as a percentage of government tax revenue
Meanwhile, government tax revenue has fallen sharply from their peak in 1990 of 60.1 trillion to 42.6 trillion yen as of 2012. Whilst interest payments remained largely stable in the 1990s and dropped during the first decade of the new millennium, this was largely due to the successive lowering of official cash rates which allowed the Japanese government to refinance its debt. As of January 31st 2013, the year 10Y Japanese Government Bond (JGB) yield stood at 76.3 basis points. Shorter tenure bonds such as the five year JGB yielded 15.2 basis points.

JGB 10Y spot yield
While monetary policy has allowed Japan to refinance its government debt at historically low rates, its interest to tax ratio has slowly increased over the last two years. When more than 20% of expected government tax revenue is to be spent on servicing debt there should be serious concerns over the sustainability of adding additional debt. When a country has reached such a high level of debt, the answer to growth is not to add on debt, but either growth to eliminate it or a sovereign restructuring. Unfortunately for Japan, it is also facing an uphill battle in terms of its ability to grow.
Japan faces a rapidly aging population as the baby-boomer generation go into retirement. Population growth for the country has steadily declined since the mid-1970s and is today barely above 0% per annum. What this implies for the economy is an increasing amount of pension obligations and laborers exiting the workforce with a much smaller force of young workers coming in to fill the gaps. Add to this a racially homogeneous country which despite increasing average annual immigration in the last decade has seen net migration of less than half a million between 2005 and 2010. The demographic trends for Japan highlight an obvious issue with mounting pension obligations and a lack of young workers to grow the economy.

Proportion of population over 65 (LHS) and net population growth rate (RHS)

Immigration (LHS) and net immigration (RHS)
On top of all these fundamental issues that still plague the Japanese economy, the latest move by the Bank of Japan to adopt a 2% inflation target as well as a commitment monthly purchases of 13 trillion yen of financial assets poses additional dangers to an already fragile Japanese economy. The reason being the signaling effect that such a measure should in theory have in the bond market and secondly the further growth of the Bank of Japan’s balance sheet.
Since 2009, Japan has experienced average annual deflation which has given JGB holders a higher real interest rate. The issue with raising inflation expectations to 2% is that in theory bondholders should demand a higher cash coupon on new JGB issuances to compensate for the inflation. While this has phenomena has yet to occur in the JGB market, the BOJ’s announcement has had significant effects in devaluing the yen.
A further look into the ownership structure of outstanding JGBs reveals some technical factors which may have hindered a rise in yields in the JGB market, but which also point to additional concerns. As of Q3 2012, foreign owners of JGB stood at only 9.1%, whilst domestic banks, life insurance companies and pension funds owned more than 70% of the outstanding JGB stock. The huge domestic ownership has allowed the Japanese government to continue monetizing its deficit without too much concern for capital flight. This however has created a very dangerous feedback loop for the government to continue piling on debt.
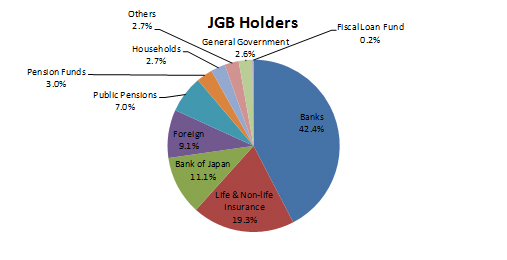
Outstanding JGB holdings
Should the Abe government attempt to inflate away its debt obligations, it will run into serious issues with future deficit financing. While the average maturity of newly issued JGBs have steadily increased in the last three years, the Japanese government runs the risk of lowering average JGB issuance maturity due to the inflation risk posed by its policies. Moreover the delicate balance held together by domestic JGB holders will not last forever. Domestic pension and insurance companies will run into financing issues when their nominal income from their JGB holdings will not be able to meet inflated pension and claims payouts.

Average JGB issuance maturity
It is perhaps surprising that Japanese five year CDS spreads have in fact tightened since February 2012. Assuming a 60% default recovery rate, Deutsche Bank data suggests an implied annual default probability 1.7% as of Feb 6th 2013, which is significantly lower the same period a year ago despite continued debt accumulation and low growth prospects.
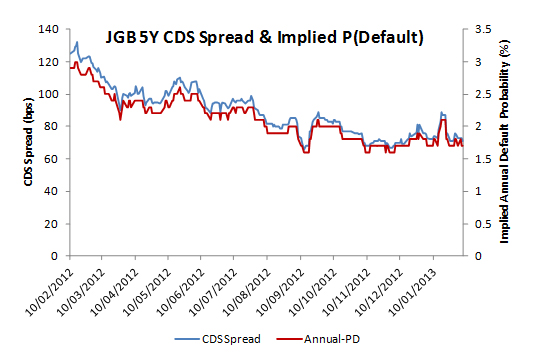
JGB 5Y CDS spread (LHS) & implied default (RHS)
In this era of unprecedented central bank easing, asset inflation has caused a disconnect between financial markets and the real economy. Less talked about are the dangerous levels of debt being accumulated by the major advanced economies. Japan is an example of the limitations of Keynesian expansionary policies and Japanese CDS represent a greatly undervalued instrument given the country’s leverage and growth outlook.

can I ask you where did you get the % of JGB holders?
this was off the MOF website