
I recently got hold of the first 50 million prime numbers and decided to play around with this dataset.Yiting Zhang’s recent work on the distribution of primes piqued my interest in visualising the consecutive differences between primes.
I decided to use a random walk procedure where the initialising direction is randomly chosen from a unit vector selection of {left, right, up or down}. The first step is then randomly chosen from one of the two directions orthogonal to this initialising vector. The magnitude is determined by the prime difference at each step.
Below are some figures for different numbers of prime differences:
2D random walk for (1 million – 1) prime differences
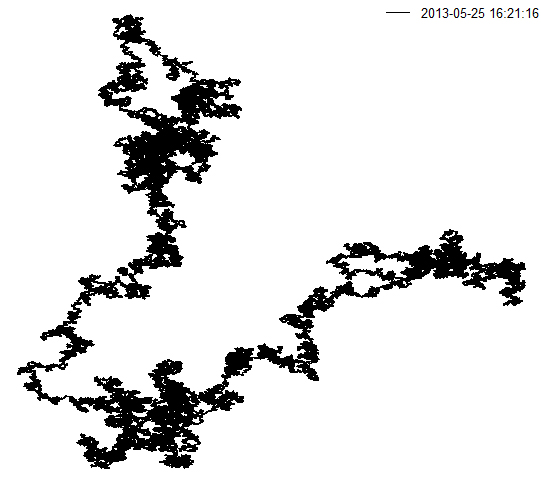
2D random walk for (20 million – 1) prime differences

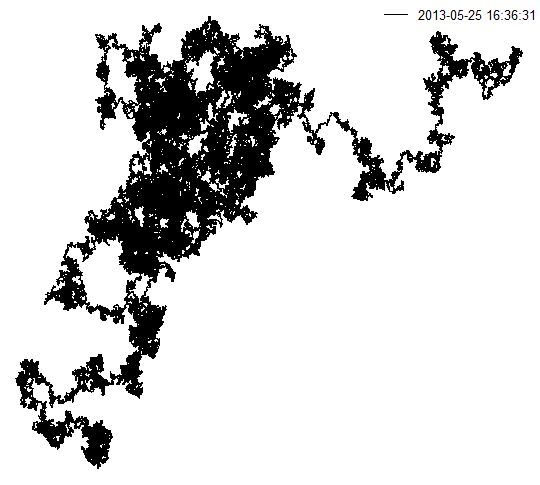
2D random walk for (50 million – 1) prime differences
Here’s the R code for the random walk procedure:
step = matrix(c(0,1,0,-1,1,0,-1,0),nrow=2,ncol=4)

x_pos = rep(0, length(primeVec))
y_pos = rep(0, length(primeVec))
move_initial = step[,sample(c(1,2,3,4),size=1)]
for(i in 2:length(primeVec)){
	index = which(move_initial%*%step==0)
	move_new = step[,sample(index,size=1)]
	dx = move_new[1]*diff[i-1]
	dy = move_new[2]*diff[i-1]
	x_pos[i] = x_pos[i-1] + dx
	y_pos[i] = y_pos[i-1] + dy
	move_initial = move_new
}
time = Sys.time()
plot(x_pos,y_pos,type='l')
legend("topright",col=1,lty=1,legend=time,bty="n",cex=0.8)
The figures above are all quite unique and this increases as the number of steps taken increases. I’ve decided to time-stamp each of the three figures as it is highly unlikely that these exact figures are to appear again. More concretely the probability of each individual sequence occurring is 0.25x(0.5)^(n-1) where n is the number of prime differences.
At a higher level, the highly stochastic nature of these random walks draws some very interesting parallels with the indeterminate nature of human life. The everyday and mundane (work routine, observations on way to get coffee) that we take for granted may not be so when you consider that they may not appear in that exact form again in your lifetime.
